NICCI THEME
2024-2026
Bridging the Investment Gap: Connecting Capital for Economic Growth
Programs


Major Initiatives

What we do
NICCI
The Nepal-India Chamber of Commerce & Industry was formed with the aspiration to promote bilateral trade and economic potential. By offering timely information and critical market analysis, NICCI curates studies, thematic programs and shared platforms for its members, in order for them to achieve insight into opportune sectors, projects and ventures in Nepal and India. ..read more
MISSION
Fostering and facilitating economic activities through the promotion of bilateral trade and investment collaboration between Nepal and India.
VISION
As a unique platform, NICCI aims to increase engagements and facilitate the promotion of bilateral business linkages to Nepali and Indian entrepreneurs.
GOAL
Sharing prosperity between Nepal and India through economic integration.
Affiliation


Patrons

Amb. Naveen Srivastava
(2022 - Incumbent)

Amb. Vinay Mohan Kwatra
(2020 - 2022)

Amb. Manjeev Singh Puri
(2017 - 2019)

Amb. Ranjit Rae
(2013 - 2017)

Amb. Jayant Prasad
(2011 - 2013)

Amb. Rakesh Sood
(2008 - 2011)
NICCI presidents

Mrs.Shreejana Rana
(2019 - 2024)

Late Saurya SJB Rana
(2015 - 2019)

Mr. Sashi Raj Pandey
(2012 - 2015)

Mr. Sanjiv Keshava
(2011 - 2012)

Mr. Arun Chaudhary
(2001- 2011)

Late Rukma Sumsher Rana
(1998 - 2001)

Late Prabhakar SJB Rana
(1993 - 1998)
News
Member Benefits
Membership
Benefits of NICCI
Join NICCI and gain access to exclusive resources, networks, and opportunities that accelerate business growth between Nepal and India.
Networking & Linkages
Develop strong professional networks across industries.
Govt. Agency Access
Direct channels to key governmental bodies & officials.
Research & Policies
Acquire the latest market research, policies, and laws.
Advocacy & Consultation
Engage in crucial stakeholder advocacy and consultations.
Capacity Building
Skill development and corporate capacity building initiatives.
SMEs & Startups
Dedicated assistance scaling your startup or SME enterprise.
Market Insights
Provide deep, actionable regional and global market insights.
Global Event Access
Access major national and global trade/commerce events.
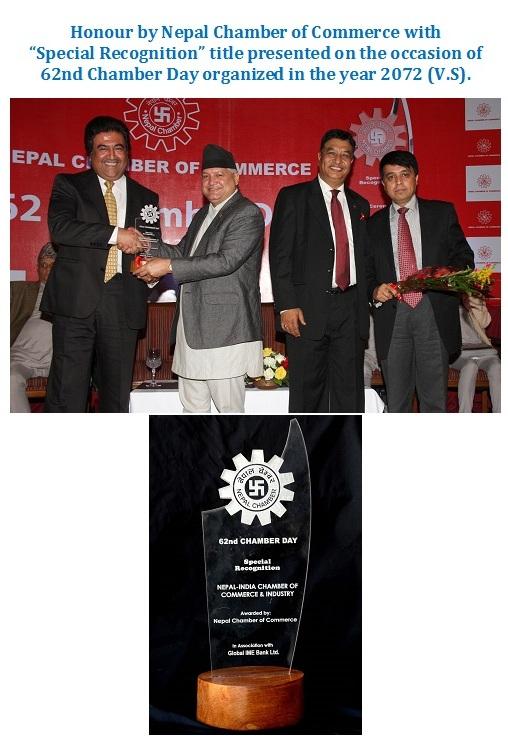
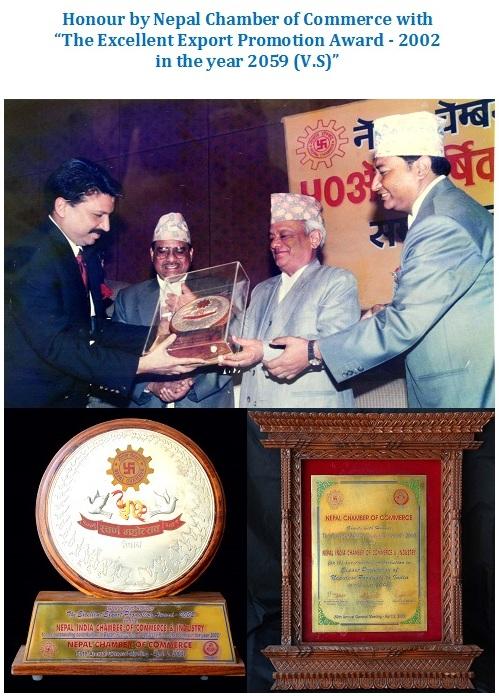
Publications


Awards